Explore Triangle Plots
Ben Wiens
4/4/2024
Source:vignettes/explore_triangle_plots.Rmd
explore_triangle_plots.RmdIntroduction
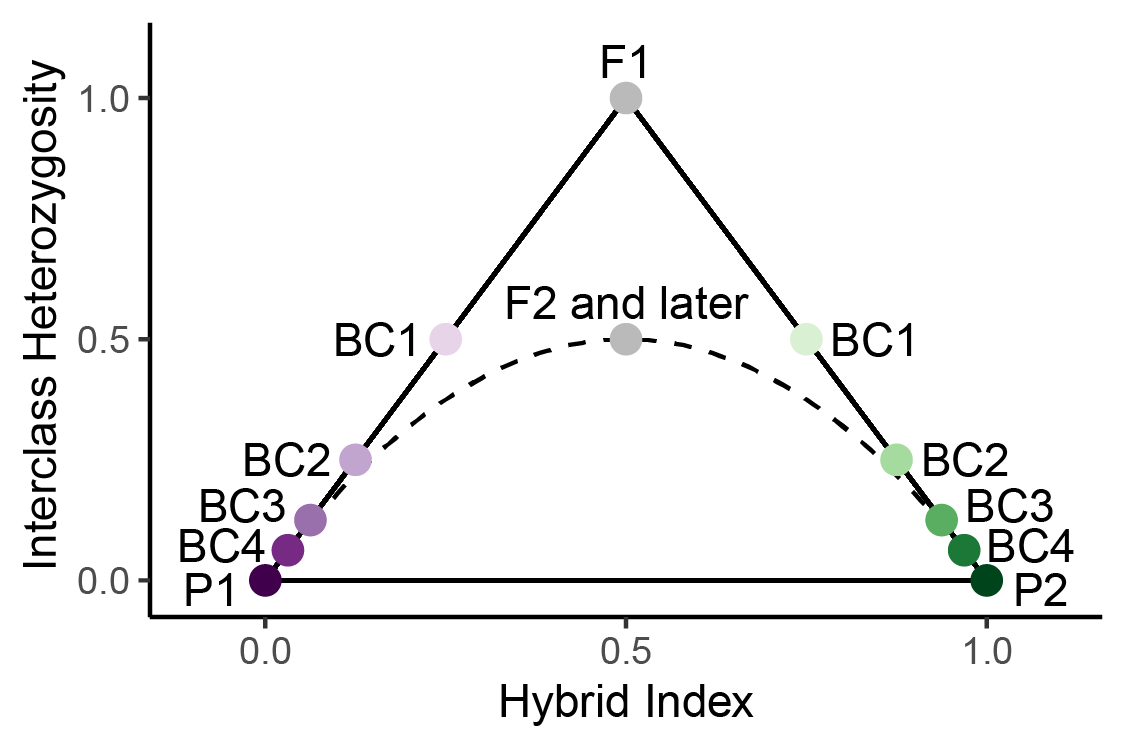 Triangle plots are a tool for visualizing genetic variation in hybrid
zones and identifying hybrid classes. Triangle plots visualize hybrid
index on the x-axis and interclass heterozygosity on the y-axis, and get
their name because the possible space on the plot forms a triangle.
Hybrid index refers to the ancestry proportions of an individual, and
interclass heterozygosity refers to the genomic sites with an allele
from both parental groups. A number of discrete hybrid classes can be
identified by their expected combination of hybrid index and interclass
heterozygosity. The placement of parentals (P1, P2), first generation
hybrids (F1s), later generation hybrids (F2s and later), and backcrosses
(BC) on a triangle plot is shown to the right For more background on
triangle plots, see the Triangle
Plot Basics page.
Triangle plots are a tool for visualizing genetic variation in hybrid
zones and identifying hybrid classes. Triangle plots visualize hybrid
index on the x-axis and interclass heterozygosity on the y-axis, and get
their name because the possible space on the plot forms a triangle.
Hybrid index refers to the ancestry proportions of an individual, and
interclass heterozygosity refers to the genomic sites with an allele
from both parental groups. A number of discrete hybrid classes can be
identified by their expected combination of hybrid index and interclass
heterozygosity. The placement of parentals (P1, P2), first generation
hybrids (F1s), later generation hybrids (F2s and later), and backcrosses
(BC) on a triangle plot is shown to the right For more background on
triangle plots, see the Triangle
Plot Basics page.
Hardy-Weinberg Equilibrium
Hardy-Weinberg Equilibirum states that under neutral evolutionary assumptions, the genotype frequencies (, , ) in the next generation are given by the allele frequencies in the current generation. Allele frequencies are denoted as and , but when there are only two alleles at a locus, can be written as , yielding the following equations for genotype frequencies. Let’s consider the hybrid index and interclass heterozygosity of individuals at sites that are fixed for alternate alelles in the parental populations. When only considering fixed differences, it follows that hybrid index equates to the frequency of alleles across the genome. Similarly, interclass heterozygosity equates to the frequency of genotypes across the genome.
When the parents have the same hybrid index, they can be thought of similarly as a population that is in HWE, and the above formulas can be used to calculate the hybrid index and interclass heterozygosity of offspring. For example, let’s consider a cross between two F1s. Both parents have a hybrid index of 0.5, which means the frequency of the allele across the genome is 0.5. Using only this information, we can calculate the genome-wide genotype frequencies of the offspring (F2s).
From the genotype frequencies of the offspring, we can obtain the frequency of the allele by dividing the frequency of genotype by (because the allele only occurs once in that genotype) and summing with the frequency of the genotype: Therefore, we obtain the expected hybrid index (0.5, frequency of the allele) and interclass heterozygosity (0.5, frequency of the genotype) in the F2 generation.
However, for crosses between parents with different hybrid indices, we must slighly modify the above formulas, because the parents are no longer in HWE. To calculate the genotype frequencies for offspring in such cases, we must take into account the difference in hybrid index between the two parents. This is done by calculating the variance () of the allele frequency in the two parents: where is the frequency of the allele in the parent and is the average frequency of the allele in the parents (Hahn, 2018). Genotype frequencies of offspring are then calculated as:
Based on the above formulas, we can calculate the hybrid index and interclass heterozygosity of any offspring given only the average allele frequency of alleles in the parents. Try it out for yourself by adjusting the hybrid index and interclass heterozygosity of the parents, and seeing where the hybrid offspring would occur on a triangle plot:
The dashed curve on the above triangle plot denotes the expected hybrid index and interclass heterozygosity under HWE. As you may have noticed, hybrid offspring will never occur below the dashed curve on the triangle plot. Why is that? We can understand this by considering two cases of crosses. In the first case, the parents have the same hybrid index. When this is the case, offspring will occur on the dashed line by definition, because the parents are in HWE. In the second case, the parents have different hybrid indices. In this case, the hybrid index of offspring will be the same as for a cross between parents of the average allele frequency, because the genotype frequencies and will decrease by the same increment (), and changes in the genotype frequency don’t change the hybrid index. However, the interclass heterozygosity will be higher than for a cross between parents of the average allele frequency, because the genotype frequency will increase by . Thus, hybrid offspring will always occur on or above the dashed curve. Of course, this is only if the assumptions of HWE hold. When any of the assumptions of HWE are violated, such as if there is selection, drift, or inbreeding, it would be possible for individuals to occur below the dashed curve.
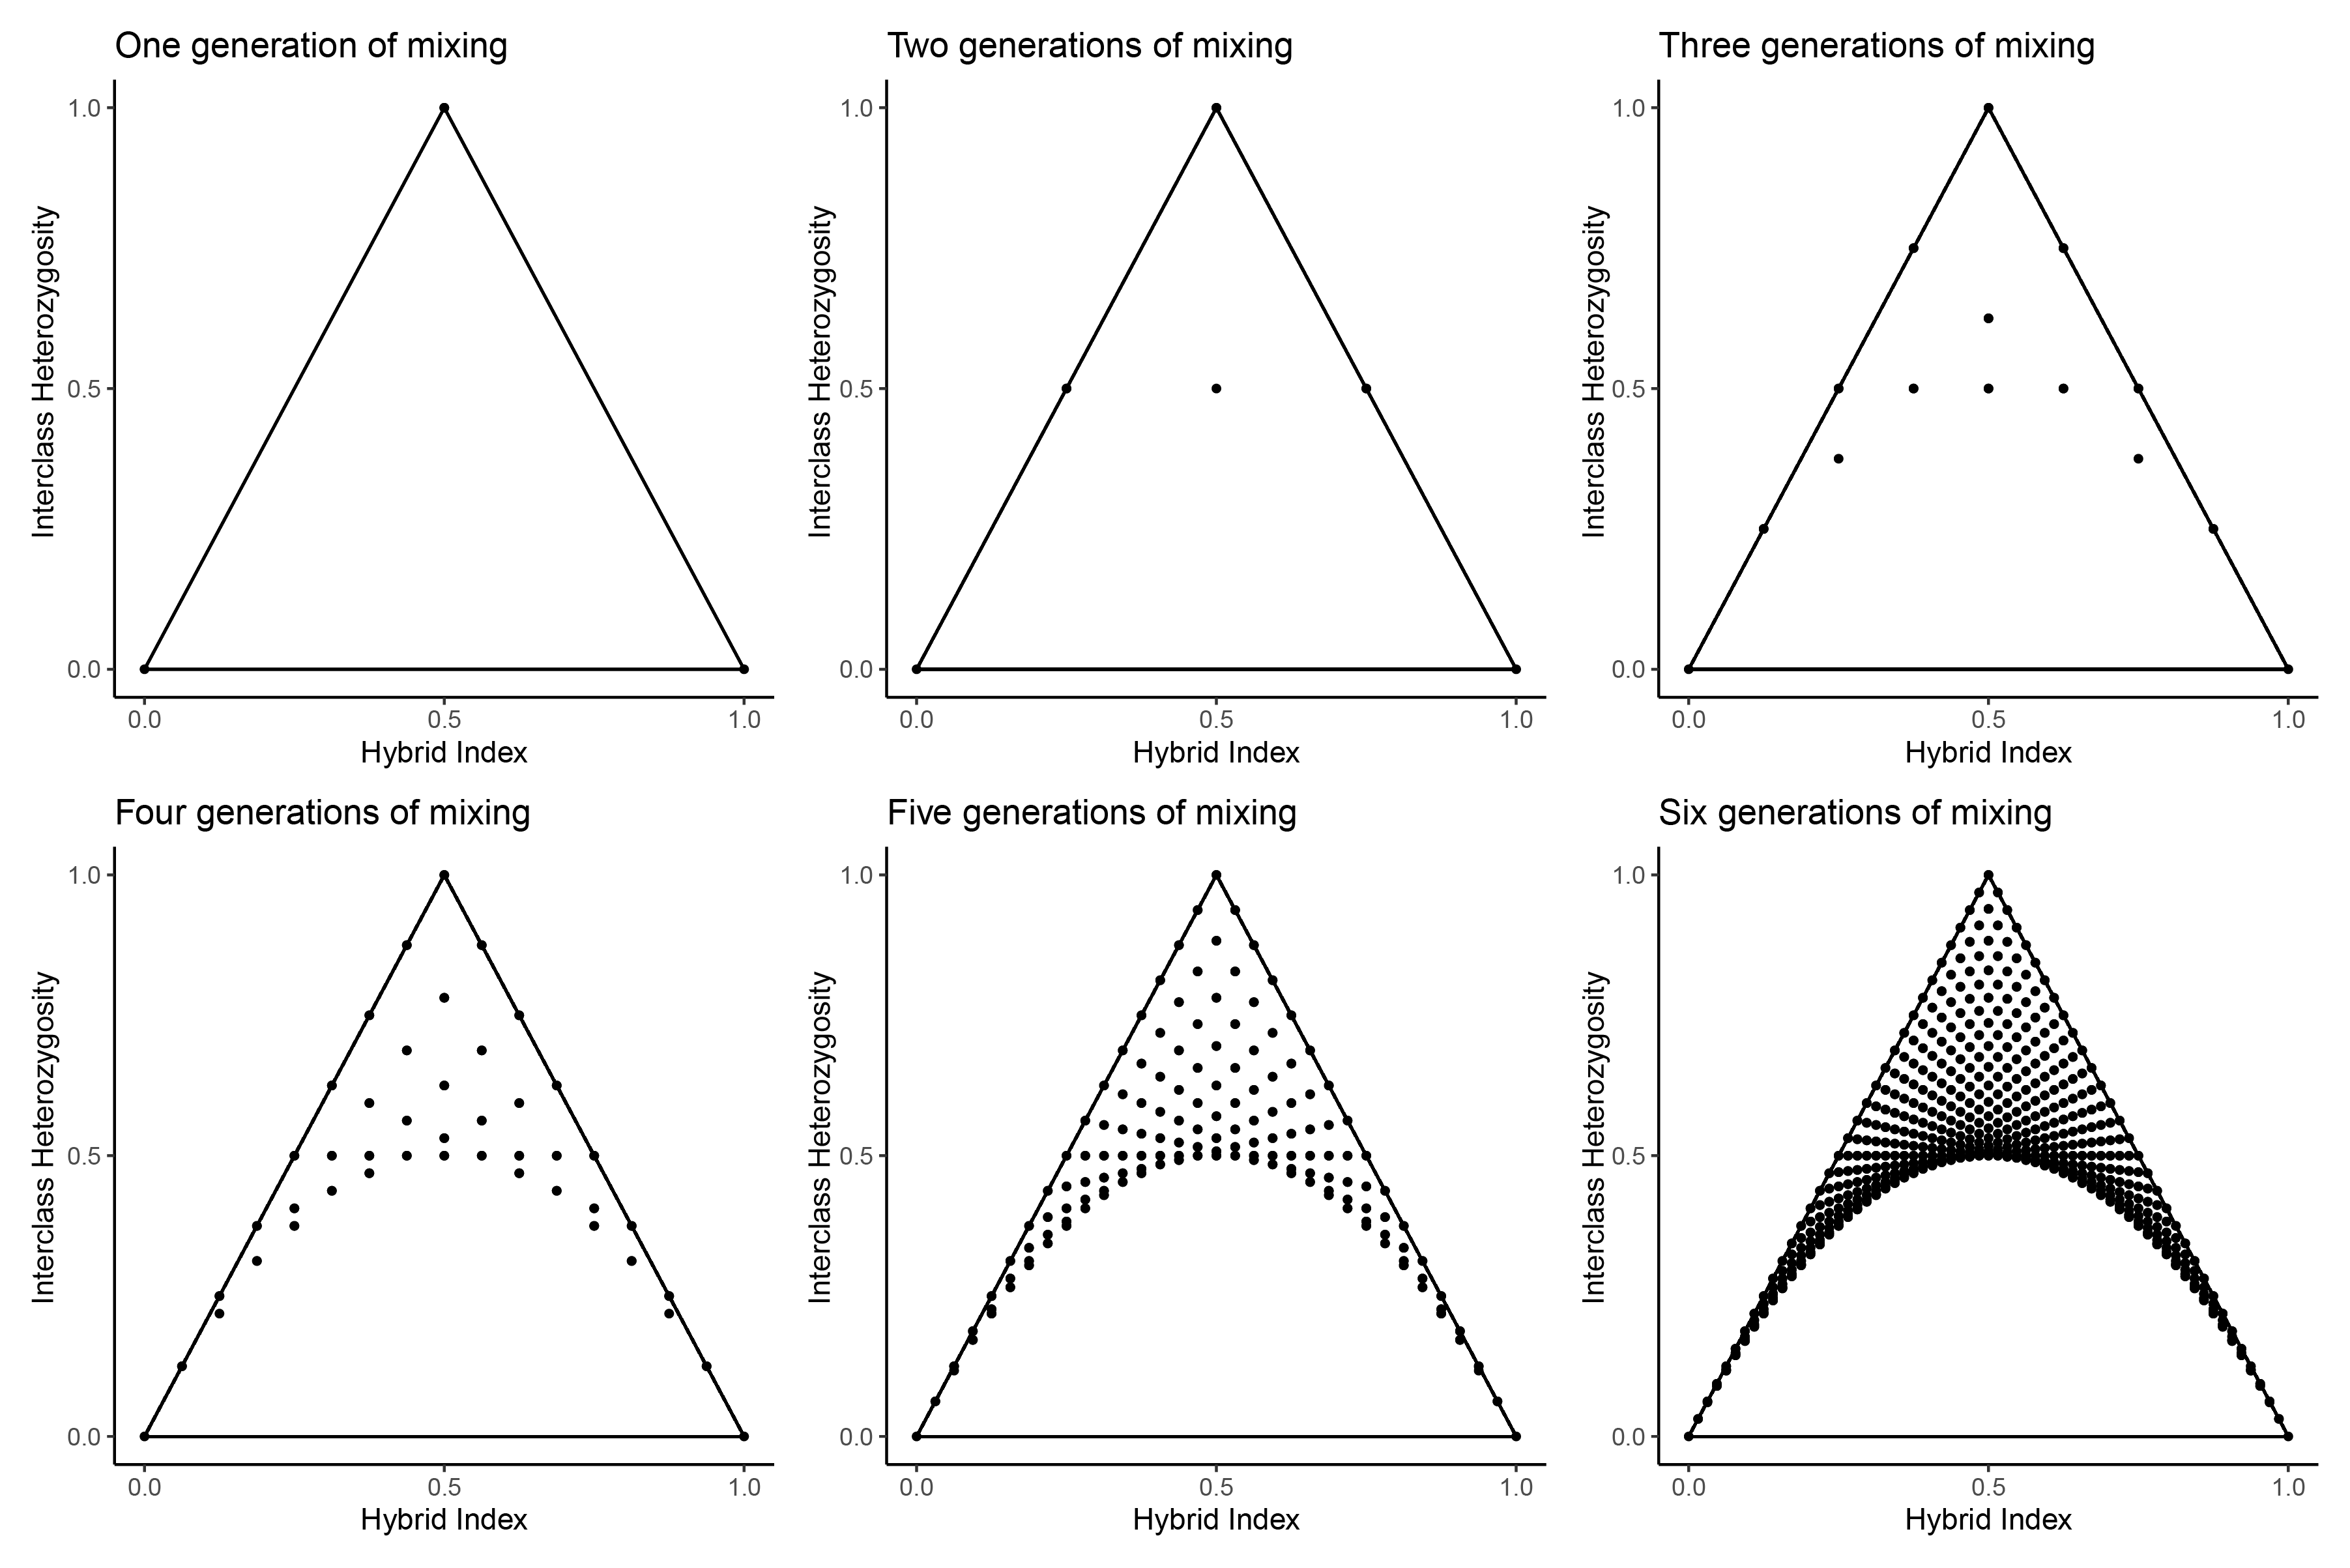
We can arrive at the same conclusions about the possible space on a triangle plot under HWE by simulating all possible matings through six generations, starting with only parental individuals. After the first generation, only parentals and F1s are present, shown in the first panel below. Each subsequent panel shows the hybrid offspring created by crossing all individuals present in the previous generation with every other individual.
$$\\[0.15in]$$
Triangle plots in practice
SNP datasets generated through genomic sequencing (e.g. WGS, RADseq, target capture) of individuals from hybrid zones can be used to build triangle plots with the R package triangulaR. The method employeed here depends on the sampling of parental populations in order to identify ancestry-informative markers (AIMs). SNPs with a high allele frequency difference between the parental populations can be used as AIMs to calculate hybrid index and interclass heterozygosity.
When analyzing empirical genetic datasets, there are a number of factors that will influence the accuracy and precision of estimated hybrid indices and interclass heterozygosity (Wiens & Colella, 2024). Some factors are out of our control, such as how divergent the parental populations are. Other factors we can control, such as how many parental individuals are sampled, how much of the genome is sequenced, and the allele frequency difference threshold used for identifying AIMs. The goal is to identify a large dataset of SNPs with high allele frequency differences between the parental populations. When divergence between parental populations is high, there will be many AIMs. Sequencing more of the genome (e.g. WGS instead of RADseq) will also provide more AIMs. Including more samples from the parental populations will increase the accuracy of estimated allele frequency differences, and thereby increase the accuracy of hybrid index and interclasss heterozygosity estimates. Lower allele frequency difference thresholds will increase the size of the AIM dataset, and allow comparisons to be made between the parental populations.
These factors all interact to influence the placement of individuals on a triangle plot. In the interactive plot below, 20 individuals from four hybrid classes (F1, F2, backcrosses in both directions) are simulated and plotted based on the imput parameters. Try playing with the parameters to see how they impact identification of hybrid classes.